
First check that both charts show the same product, month, time zone, and trading hours. Then check the kind of prices used. Two charts with the same short name may not show the same data. IBKR also filters some past trade data.
Educational software guidance. Trading involves risk. Read the financial and information disclaimers.
Step by step
- 1 Match the exact listed product or futures expiry on both charts.
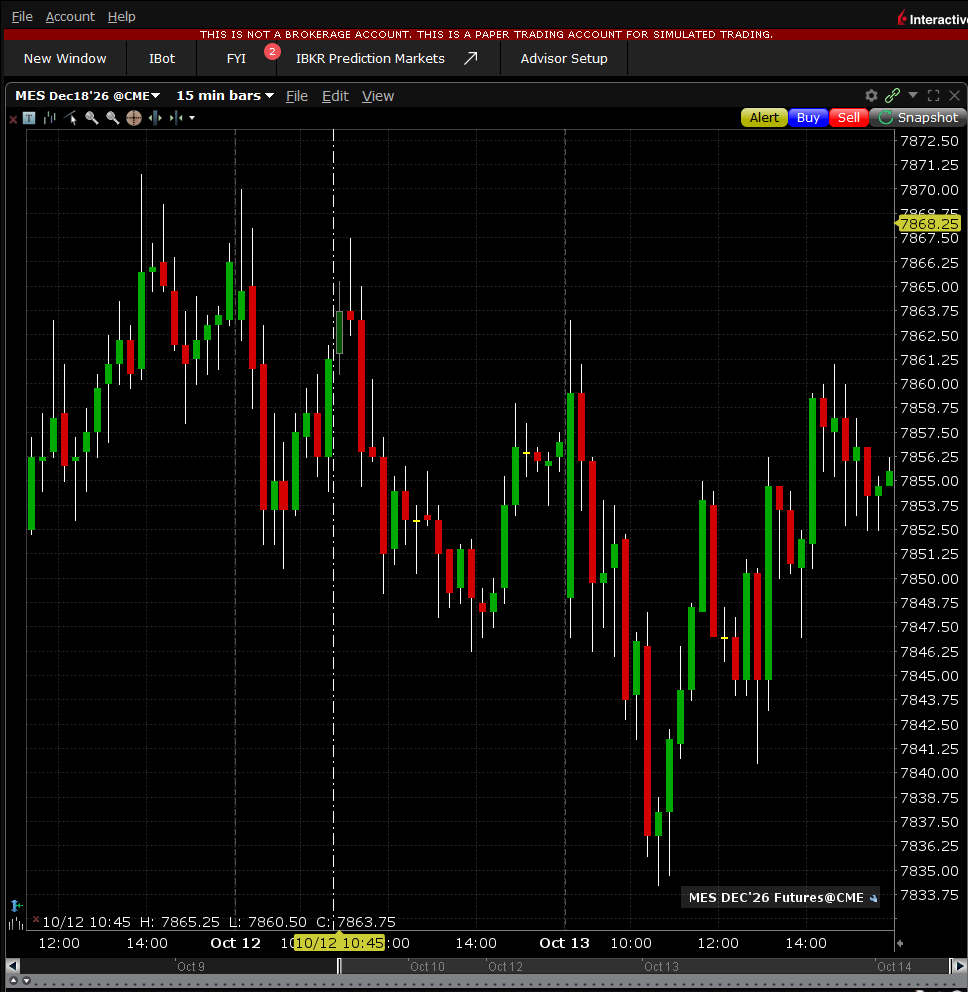
The TWS chart for the December 2026 Micro E-mini S&P 500 future, on 15-minute bars. 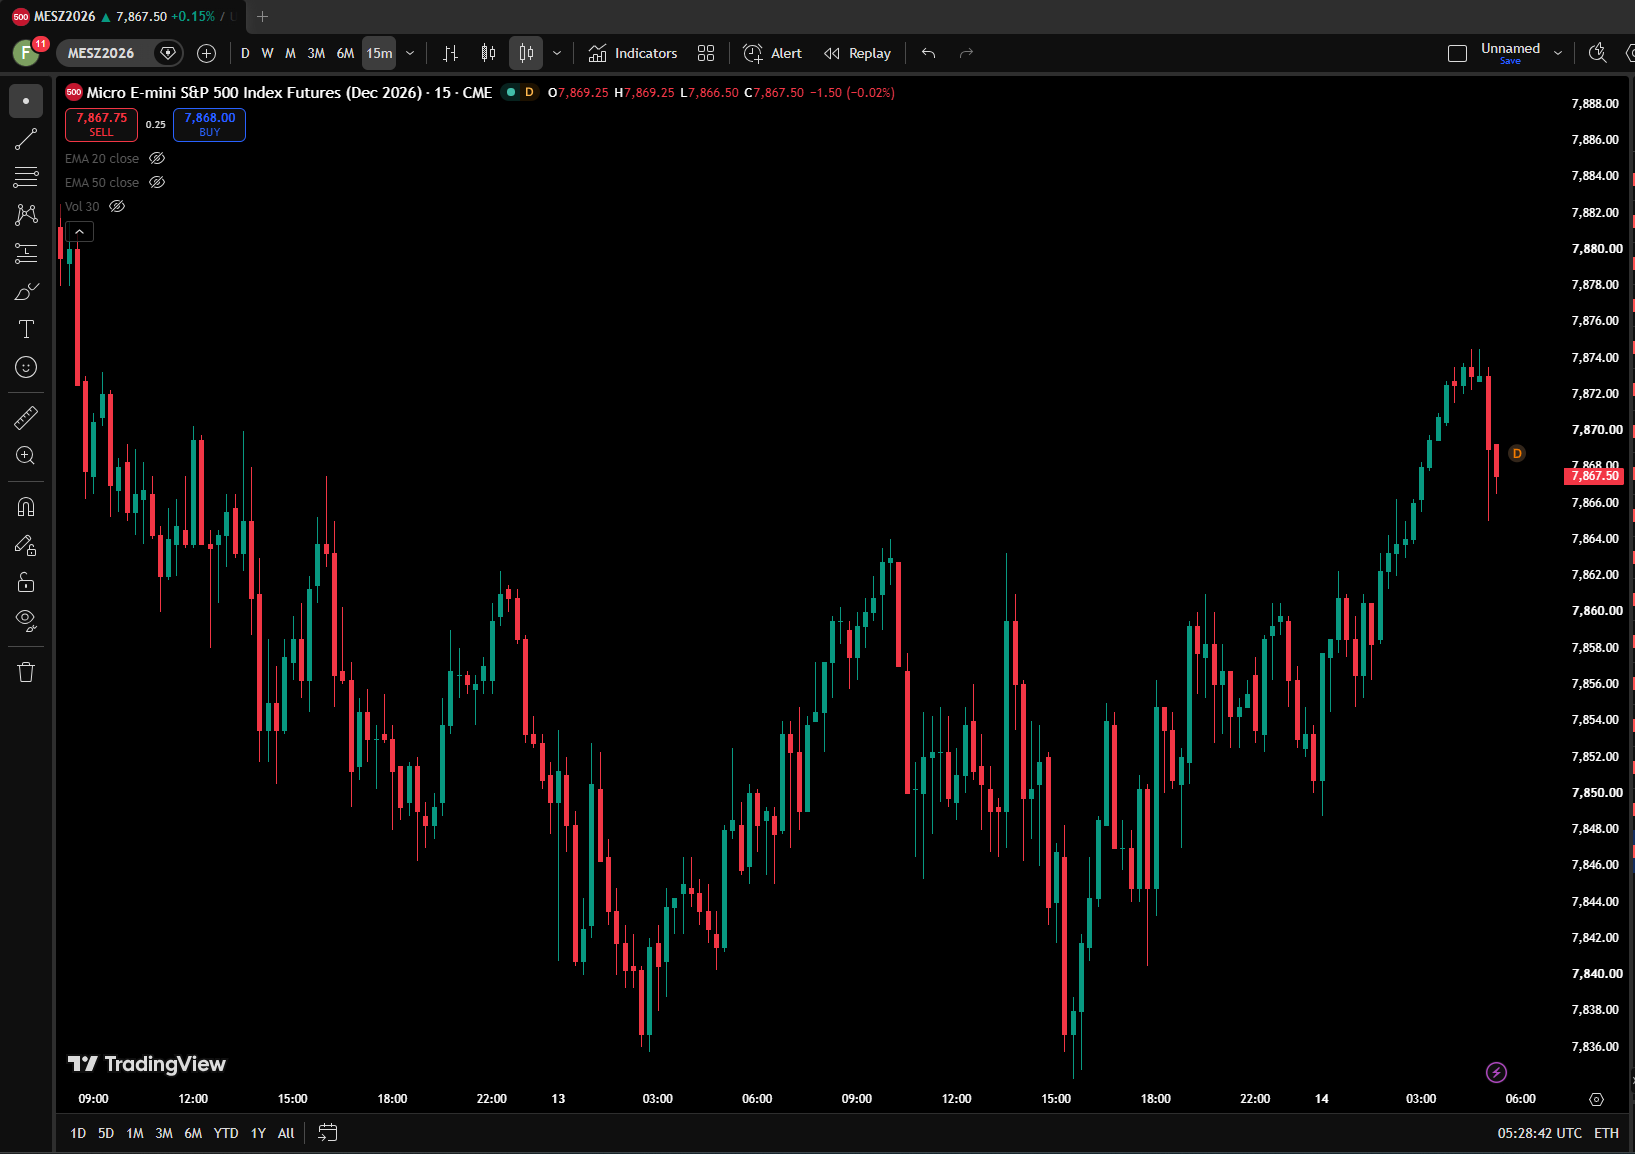
The TradingView chart for the same contract and interval; compare expiry, bar interval, session and time zone with the TWS chart. - 2 Set matching bar intervals and session coverage, including extended hours.
- 3 Compare time zones and the timestamps at each bar boundary.
- 4 Check whether values are trades, bid, ask, midpoint, or adjusted prices.
- 5 Compare a small known time interval and document the remaining difference.
A practical example
One chart starts its day at the regular open, while the other includes trades before that time. Their daily bars can differ even if both are working as designed. Start with one short hour and the same product. Match the time zone and session. For a future, also match the month. A long continuous chart may not be the same series as the single contract you plan to trade.
Screen reference
Mistake to avoid
Common questions
Do different candles prove one platform is wrong?
No. First align the chart definitions and feeds.
Can historical volume differ from real-time volume?
IBKR documents filtering differences between those data paths.