Quotes and charts

TWS historical volume and VWAP differ from live data

Quick answer

IBKR documents filtering and adjustments in historical data that can make it differ from a live stream. Match the session and data type before diagnosing a volume or VWAP mismatch.

Educational software guidance. Trading involves risk. Read the financial and information disclaimers.

Step by step

  1. 1 Choose one contract and a short time interval for comparison.
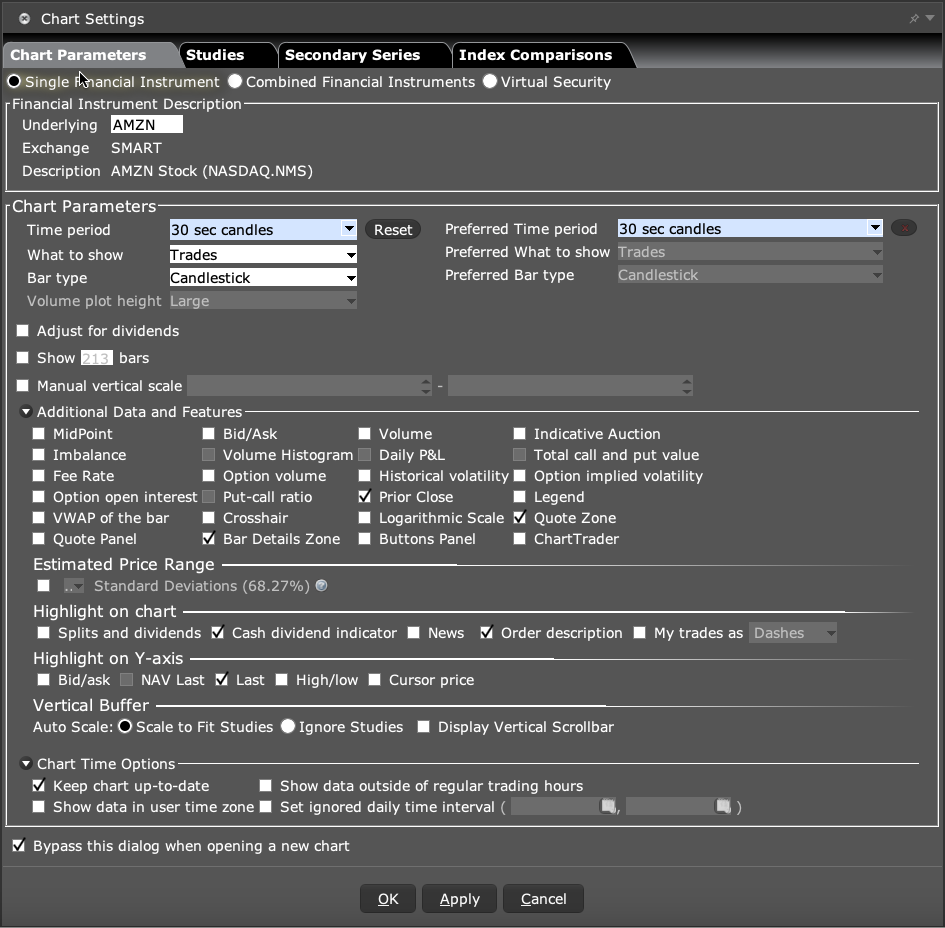
  2. 2 In the TWS chart, open Edit → Chart Parameters. Compare What to show and Show data outside of regular trading hours with the other source. Volume and VWAP of the bar are separate controls in the same dialog.
  3. 3 Record whether each value comes from live ticks or a historical request.
  4. 4 Compare the treatment of adjusted data and included trade types.
  5. 5 Keep the query and a repeatable example if a gap remains unexplained.

A practical example

Suppose one total came from a live stream and another came from a chart-history request. The two paths may not count the same set of trades. Note the source and time of each total. Check the session first, then the broker’s filtering rules. Do not call one value wrong just because the two numbers differ. Give support a small sample with clear labels rather than two unexplained totals.

Illustrative scenario, not a record of a trade placed during this review.

Screen reference

TWS Chart Parameters showing time period, data type, bar type, volume, VWAP and session controls
Compare Time period and What to show first. Additional Data and Features contains Volume and VWAP of the bar. Chart Time Options contains the extended-hours and user-time-zone controls. The dialog was closed with Cancel; no settings were applied. Captured in TWS paper mode on 3 October 2026. Open the image for full size.
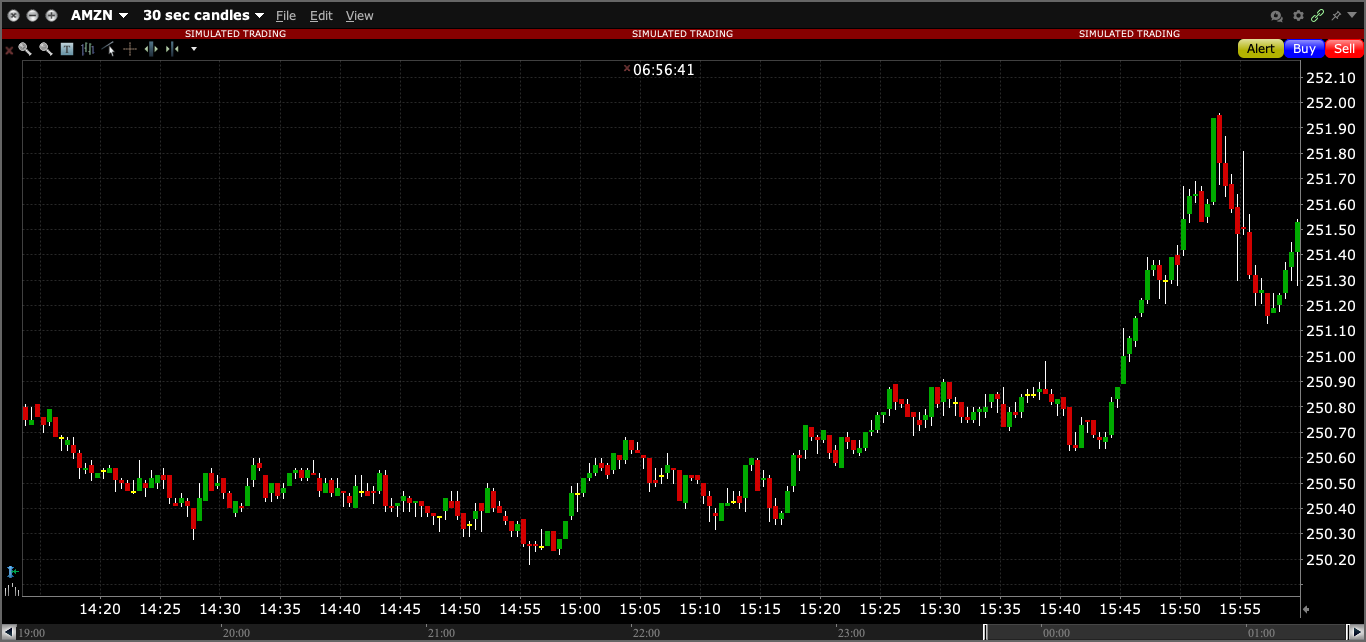
TWS 30-second candlestick chart with the Edit menu and time axis
This chart is an example of the chart window. It is not evidence of a live feed, a particular API request, or a trading signal. Use Edit → Chart Parameters to inspect its inputs. Captured in TWS paper mode on 3 October 2026. Open the image for full size.
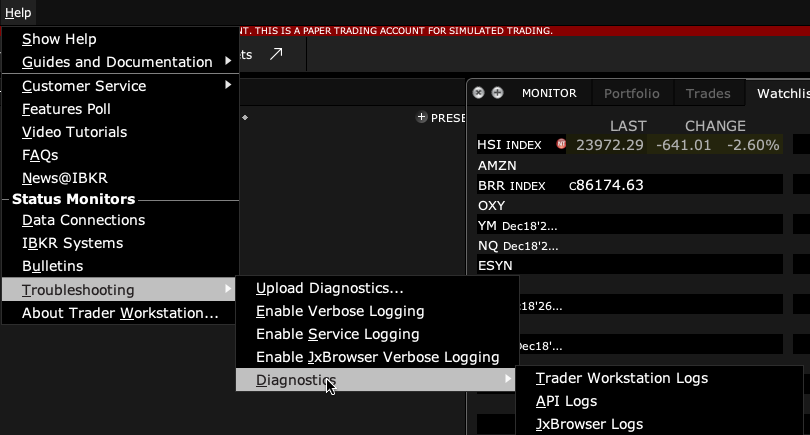
Help, Troubleshooting, Diagnostics menu leading to API Logs
In this build, follow Help → Troubleshooting → Diagnostics → API Logs. Upload Diagnostics is a different action. Captured in TWS paper mode on 3 October 2026. Open the image for full size.
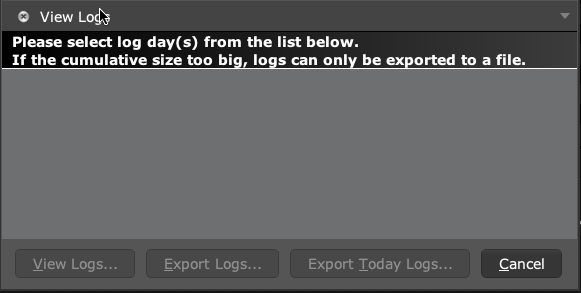
TWS View Logs dialog with View Logs, Export Logs and Export Today Logs buttons
This session has no recorded API logs in the list, so export buttons are disabled. Enable API logging before the event you need to capture. No log was exported or uploaded for this screenshot. Captured in TWS paper mode on 3 October 2026. Open the image for full size.
How to confirm the result You should be able to explain the data definitions being compared instead of treating all volume fields as the same.

Mistake to avoid

Do not silently rewrite a historical series to force agreement with a different feed.

Common questions

Is every difference a bug?

No. Filtering can legitimately change reported historical volume or VWAP.

Will a reload always produce the same values?

Historical data can be adjusted; note when each sample was retrieved.

Financial and information disclaimers

Financial disclaimer

These guides explain software. They are for education, not financial, investment, tax, or legal advice. No example is a suggestion to buy or sell a product or use a trading strategy. Trading can lose money, including all funds you put at risk. With margin, futures, short sales, or some options, losses can exceed your starting funds. Automation can fail, send duplicate orders, or act late. Stops do not guarantee a fill or a price. Review your orders and positions, and seek advice from a qualified professional for your own needs. Paper trades, examples, and past results do not predict live results or promise a profit.

Information disclaimer

This is general help based on the sources and check date shown on the page. Screens, settings, fees, data access, and product support can change or differ by app version, account, country, and broker. The content may contain errors or become out of date; accuracy, completeness, and continuous service are not guaranteed. Check current broker and app instructions before acting. Screenshots show where controls are; they do not prove that an order test passed. This guide does not replace broker terms or risk notices. References to IBKR and TradingView identify their products and do not imply their endorsement of this guide.

IBKR risk disclosures · IBKR paper-trading limits · SEC guidance on automated investment tools

PickMyTrade help · Independent guidance for Trader Workstation and the desktop integration. TWS images show paper trading. Other applications are named in the image captions. Settings and availability can vary by version and account.

Automate TradingView alerts to Interactive Brokers

See the IBKR integration